
Dissociation of solid tumors, like CT26 colorectal carcinoma, enables the tumor microenvironment to be explored at the single-cell level, providing valuable insights into immune response and disease progression. Accurate analysis of solid tumors requires efficient and effective dissociation to maintain the integrity and heterogeneity of the native cell population. Efficiency and efficacy are improved in an acoustic dissociation on the SimpleFlow, as compared to an enzymatic digestion.
The choice of dissociation method is crucial in determining the quality of the resulting single-cell suspension (1). Enzymes are known to bias solid tumor dissociations through selectively releasing certain types of cells from tissue, inducing transcription with heat, and damaging cell surface epitopes (2). Flow cytometry requires the preservation of cell surface proteins. When these markers are stripped from cells, or whole populations are eliminated, cancer research is greatly inhibited by the biased single-cell suspension.
In this experiment, we demonstrate that a six-minute acoustic dissociation on the SimpleFlow better preserved CD45, CD4, CD19, CD27, CD100, CD229 and CD44 cell surface markers of CT26 cells. Tumors dissociated without enzymes on the SimpleFlow had up to six times the expression as measured by MFI fold change, compared to even a mild (2) enzymatic digestion with Collagenase IV and DNase.
See the expression difference with SimpleFlow™

A) After gating for live cells, CD45, CD3, and CD4, cells were plotted on CD27 vs. FSC-A. B) The CD27+ population plotted on a CD27 histogram. C) Percentage of CD27+ cells out of all live cells was significantly higher for the SimpleFlow acoustic dissociation (green) compared to the enzyme dissociation (orange). D) MFI of CD27+ cells for the SimpleFlow acoustic dissociation was significantly increased versus the enzyme dissociation.

A) After gating for live cells, CD45, CD3, and CD8, CD8+ cells were plotted on CD100 vs. FSC-A. B) The CD100+ population plotted on a CD100 histogram. C) Percentage of CD100+ cells out of all live cells for the SimpleFlow acoustic dissociation (green) was signifcantly higher than that recovered in an enzyme dissociation (orange). D) MFI of CD100+ cells for the SimpleFlow acoustic dissociation was significantly increased compared to an enzyme dissociation.

A) After gating for live cells, a leukocyte gate was drawn on CD45 vs. FSC-A. The CD45- (non-leukocyte) group was plotted on CD44 vs. FSC-A (9). B) The CD44+ population plotted on a CD44 histogram. C) Percentage of CD44+ cells out of all live cells for the SimpleFlow acoustic dissociation (green) and enzyme dissociation (orange). D) MFI of CD44+ cells for the SimpleFlow acoustic dissociation and enzyme dissociation.
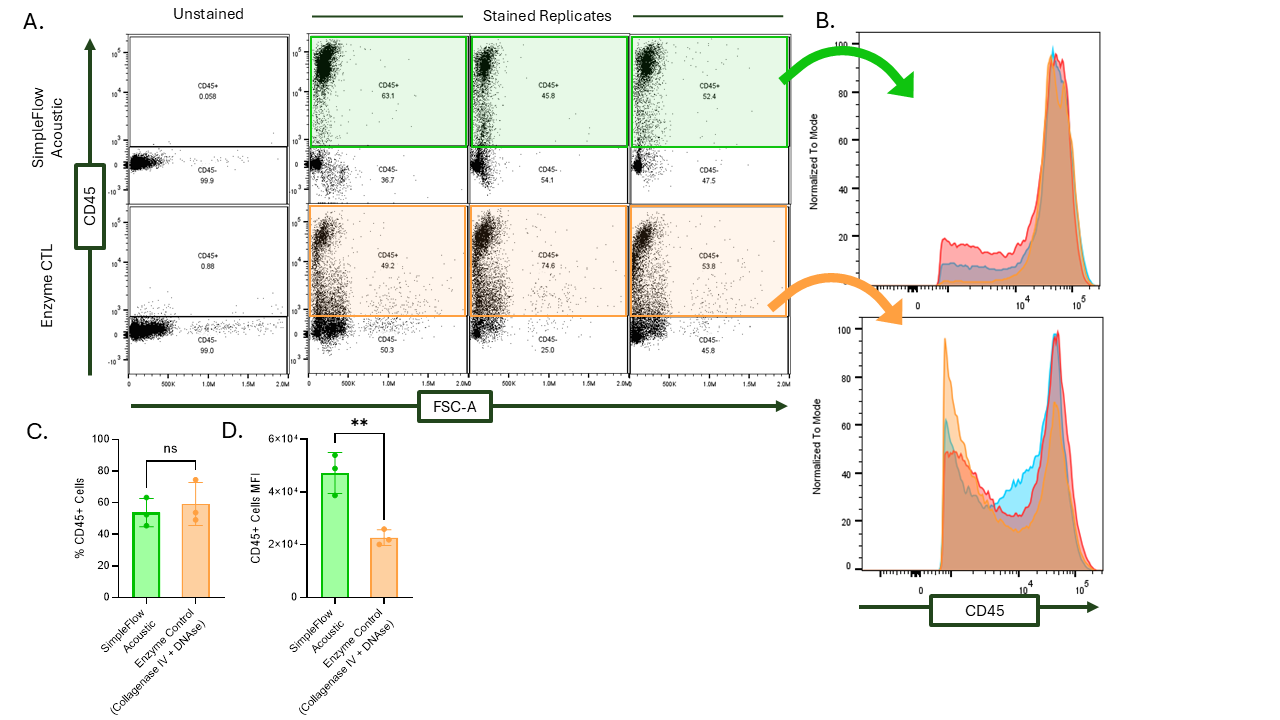
A) After gating for live cells, a leukocyte gate was drawn on CD45 vs. FSC-A. The acoustically dissociated cells have visibly higher MFI near the top of the graph while the enzymatically dissociated leukocytes blur with the CD45- population. B) The CD45+ population plotted on a CD45 histogram. C) Percentage of CD45+ cells out of all live cells for the SimpleFlow acoustic dissociation (green) and enzyme dissociation (orange). D) MFI was significantly higher for CD45+ cells dissociated acoustically on the SimpleFlow compared to the enzyme dissociation.

A) After gating for live cells and CD45, CD3 was gated on a plot of CD3 vs. CD27. B) The CD3+ population plotted on a CD3 histogram. C) Percentage of CD3+ cells out of all live cells for the SimpleFlow acoustic dissociation (green) and enzyme dissociation (orange). D) MFI of CD3+ cells for the SimpleFlow acoustic dissociation and enzyme dissociation.

A) After gating for live cells, CD45, and CD3, cells were plotted on CD4 vs. CD8 to differentiate Helper T Cells and Cytotoxic T Cells. B) The CD4+ population plotted on a CD4 histogram. C) Percentage of CD4+ cells out of all live cells for the SimpleFlow acoustic dissociation (green) and enzyme dissociation (orange). D) MFI of CD4+ cells for the SimpleFlow acoustic dissociation was significantly increased versus the enzyme dissociation.

A) After gating for live cells, CD45, and CD3, cells were plotted on CD4 vs. CD8 to differentiate Helper T Cells and Cytotoxic T Cells. B) The CD8+ population plotted on a CD8 histogram. C) Percentage of CD8+ cells out of all live cells for the SimpleFlow acoustic dissociation (green) and enzyme dissociation (orange). D) MFI of CD8+ cells for the SimpleFlow acoustic dissociation and enzyme dissociation.

A) After gating for live cells and CD45, cells were plotted on CD19 vs. FSC-A. The SimpleFlow has a cleaner and more defined B Cell population. B) The CD19+ population plotted on a CD19 histogram. C) Percentage of CD19+ cells out of all live cells for the SimpleFlow acoustic dissociation (green) and enzyme dissociation (orange). D) MFI of CD19+ cells for the SimpleFlow acoustic dissociation and enzyme dissociation.

A) After gating for live cells, CD45, and CD19, cells were plotted on CD229 vs. FSC-A. B) The CD229+ population plotted on a CD229 histogram. C) Percentage of CD229+ cells out of all live cells for the SimpleFlow acoustic dissociation (green) and enzyme dissociation (orange). D) MFI of CD229+ cells was significantly increased for the SimpleFlow acoustic dissociation compared to the enzyme dissociation.
The acoustic dissociation protocol presented here provides an alternative to enzymatic dissociation with comparable sample preparation and post-dissociation steps but eliminates the long incubations required to activate enzymes. This reduces the total workflow down from over an hour to 25 minutes as displayed in Figure 10. This fast, yet gentle dissociation shortens the time from dissociation to downstream analysis, thus reducing the overall stress on cells.

Figure 10. Comparison of the 25-minute SimpleFlow workflow to the 70-minute enzyme workflow.
To investigate the differences in single-cell quality between SimpleFlow’s acoustic dissociation and a gentle enzymatic dissociation, 5 × 10⁵ CT26 cells were implanted subcutaneously into BALB/c mice and allowed to grow for approximately four weeks. Tumors were divided into ~100 mg samples and assigned to either the SimpleFlow acoustic or the Collagenase IV + DNase enzymatic dissociation method. For the SimpleFlow acoustic dissociation, replicates were minced 200 times within the Cellsonics Dissociation Cartridge then subjected to low-amplitude acoustic pulsing while held in a temperature controlled 4 °C water bath for six minutes. For the enzymatic digestion samples were minced using a razor blade until homogenous, then incubated with Collagenase IV and DNase for 45 minutes at room temperature on the GentleMACS using a program with gentle mixing. Both groups were filtered through a 70-micron cell strainer and washed before proceeding with staining and flow cytometry on the BD Symphony. Data was processed using FlowJo Version 10.10.0 and data was analyzed using an unpaired two-tailed student’s t-test on GraphPad Prism 10.
Flow cytometry characterized many markers with reduced or altered expression when comparing the enzymatic dissociation to acoustic dissociation on the SimpleFlow, as described in Table 1. Due to the harsh enzyme dissociation, in some cases whole populations were missing or greatly reduced. For many of the events that maintained their positivity for certain markers, lower MFI signal was observed, indicating that many cell surface markers were damaged or removed from live cells when using an enzyme. Cleaved cell surface markers are evidence of poor cell health and have negative consequences for downstream analyses and applications like flow cytometry, flow activated cell sorting, CITE-seq, and outgrowth.
Even compared to an optimized, mild enzyme dissociation, SimpleFlow enhances the performance of flow cytometry as cell surface epitopes are better preserved with higher MFIs. Improved parenchymal representation and brighter signals push your cancer research forward by enabling faster and more dependable antibody-based analysis.
 Table 1. Summary of MFI decrease using caused by enzymatic dissociation of CT26 carcinoma.
References
- Lischetti U, Tastanova A, Singer F, Grob L, Carrara M, Cheng PF, et al. Dynamic thresholding and tissue dissociation optimization for CITE-seq identifies differential surface protein abundance in metastatic melanoma. Commun Biol. 2023 Aug 10;6(1):1–16.
- Reichard A, Asosingh K. Best Practices for Preparing a Single Cell Suspension from Solid Tissues for Flow Cytometry. Cytom Part J Int Soc Anal Cytol. 2019 Feb;95(2):219–26.
- Sato Y, Fu Y, Liu H, Lee MY, Shaw MH. Tumor-immune profiling of CT-26 and Colon 26 syngeneic mouse models reveals mechanism of anti-PD-1 response. BMC Cancer. 2021 Nov 13;21(1):1222.
- Prasad KVS, Ao Z, Yoon Y, Wu MX, Rizk M, Jacquot S, et al. CD27, a member of the tumor necrosis factor receptor family, induces apoptosis and binds to Siva, a proapoptotic protein. Proc Natl Acad Sci U S A. 1997 Jun 10;94(12):6346–51.
- Thomas LJ, He LZ, Marsh H, Keler T. Targeting human CD27 with an agonist antibody stimulates T-cell activation and antitumor immunity. OncoImmunology. 2014 Jan;3(1):e27255.
- Zhang Y, Liu B, Ma Y, Jin B. Sema 4D/CD100-plexin B is a multifunctional counter-receptor. Cell Mol Immunol. 2013 Mar;10(2):97–8.
- Ramezani S, Parkhideh A, Bhattacharya PK, Farach-Carson MC, Harrington DA. Beyond Colonoscopy: Exploring New Cell Surface Biomarkers for Detection of Early, Heterogenous Colorectal Lesions. Front Oncol. 2021 Jul 5;11:657701.
- Roncador G, Puñet-Ortiz J, Maestre L, Rodríguez-Lobato LG, Jiménez S, Reyes-García AI, et al. CD229 (Ly9) a Novel Biomarker for B-Cell Malignancies and Multiple Myeloma. Cancers. 2022 Apr 26;14(9):2154.
Want to see data for your favorite cell surface marker?
Ask for a 20-minute seminar from a Cellsonics Scientist


.png?width=300&height=54&name=CellsonicsLogoWhite(2048%20x%20366%20px).png "CellsonicsLogoWhite(2048 x 366 px)")